Tracking important values with Monitors, MonitorsChannel, and Plots!
about 10 years ago by Markus Beissinger
Debugging deep nets it hard. That's why we are introducing Monitor objects that let you evaluate expressions and variables from your model in real time during training and testing!
Here's how it works:
- You create a Monitor object with a string name (so you remember what the value represents), a Theano expression to evaluate during the model's training, and optionally which datasets (train, valid, test) you want to evaluate the expression on.
import theano.tensor as T
from opendeep.monitor.monitor import Monitor

weights_mean = T.mean(self.weights)
weights_std  = T.std(self.weights)
mean_monitor = Monitor(name="mean", expression=weights_mean, train=True)
std_monitor = Monitor(name="std", expression=weights_std, train=True)- You group similar Monitors into a MonitorsChannel object (think of it as a single graph, where each monitor in the channel gets plotted).
from opendeep.monitor.monitor import MonitorsChannel

weights_channel = MonitorsChannel(name="weights", monitors=[mean_monitor, std_monitor])- You (optionally) create a Plot object from these MonitorsChannels, which takes care of plotting the values in real time using Bokeh.
from opendeep.monitor.plot import Plot

plot = Plot(bokeh_doc_name="Plotting!", monitor_channels=[weights_channel])- These MonitorsChannels and/or Plot gets passed to the .train() function of the Optimizer! (If you want to use the plot, it is better to start bokeh-server from the command line first).
bokeh-serverfrom opendeep.optimization.adadelta import AdaDelta
optimizer = AdaDelta(model=your_model, loss=your_loss, dataset=your_dataset)
# if you want to use the plotting
optimizer.train(plot=plot)
# if you just want the monitors evaluated and logged
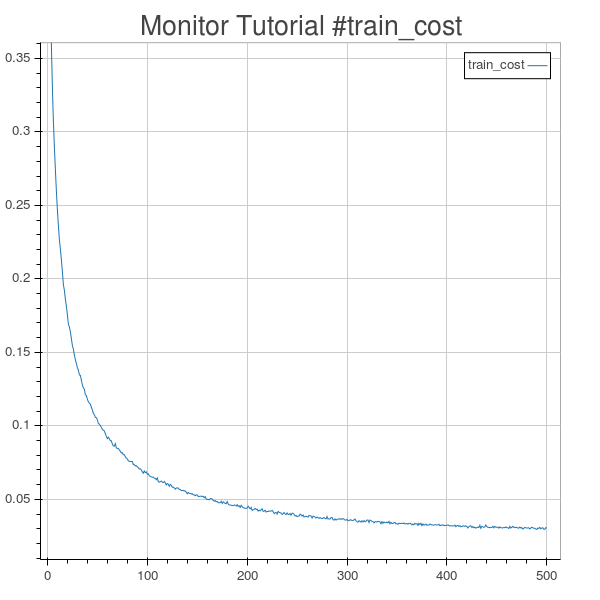
optimizer.train(monitor_channels=[weights_channel])Finally, a monitor known as train_cost will always be evaluated (even if you don't input any Monitor objects)! This is the cost expression your model is using for training.
Here are some example plots from the Monitors and Live Plotting guide:

Plotting MLP train cost.

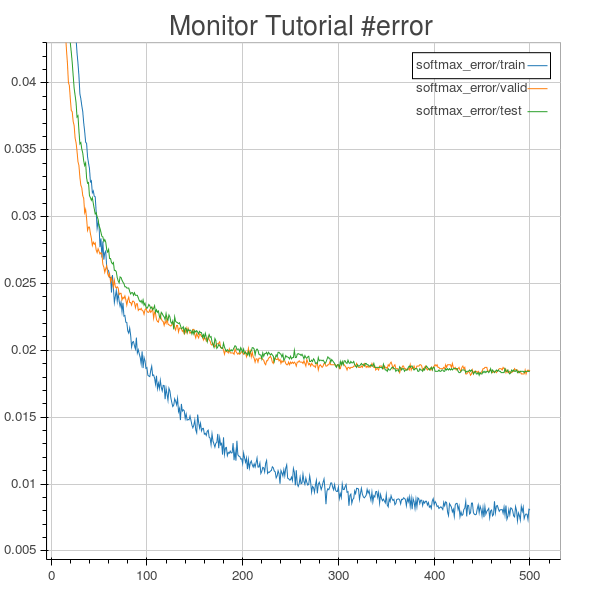
Plotting MLP softmax classification error on train, valid, and test sets.

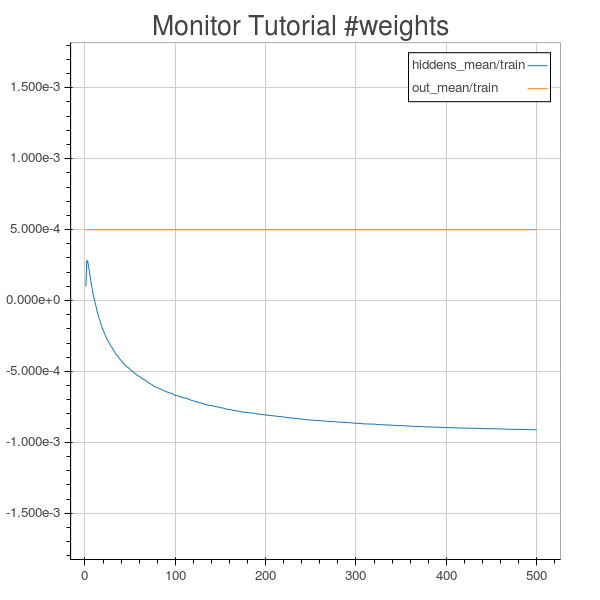
Plotting the mean values of MLP weights matrices.
Changelog
